The cluster birth environment (, , , SFE)
sets the IMF slopes via the Marks et al. (2012) Fundamental Plane and the
Jeřábková et al. (2018) IGIMF, exposed through BirthEnvironment,
env_to_imf_params, alpha3_marks_plane, and lowmass_slopes_metallicity. Test
files: tests/validation/test_environment_physics.py (vs published tables) and
tests/unit/imf/test_environment.py (see the test dashboard
for the live per-suite counts); figures:
scripts/validate_environment.py. Theory at Environment-dependent IMFs.
What is verified
Rows map to test_environment_physics.py; Measured values are regenerated by
scripts/validate_environment.py.
Property | Tolerance (as tested) | Measured | Anchor |
|---|---|---|---|
(NGC 104) Fundamental Plane | 1.500 (pub 1.34) | Marks et al. (2012) Table 1 | |
(NGC 6341) | 1.076 (pub 1.11) | Marks et al. (2012) Table 1 | |
(NGC 6752) | 1.244 (pub 1.27) | Marks et al. (2012) Table 1 | |
(NGC 7078 / M15) | 0.844 (pub 0.76) | Marks et al. (2012) Table 1 | |
NGC 7078 is the most top-heavy | min of the four | True (0.844 is min) | M15 starburst birth |
Density dominates metallicity | 0.40 vs 0.06 (ratio 7.1) | Fundamental-Plane | |
Low-mass slopes ([Fe/H]) | (5 anchors) | 0.0000 (exact) | Marks et al. (2012) Table 4, Eq. 12 |
Erratum-corrected Marks Jeřábková | max | 0.008 (rounding only) | same -0.87 relation (2014 erratum) |
differentiability (AD vs FD) | rel err | ([Fe/H], ) |
Figures
Generated by scripts/validate_environment.py (PASS/FAIL per panel; PNG + PDF vector).
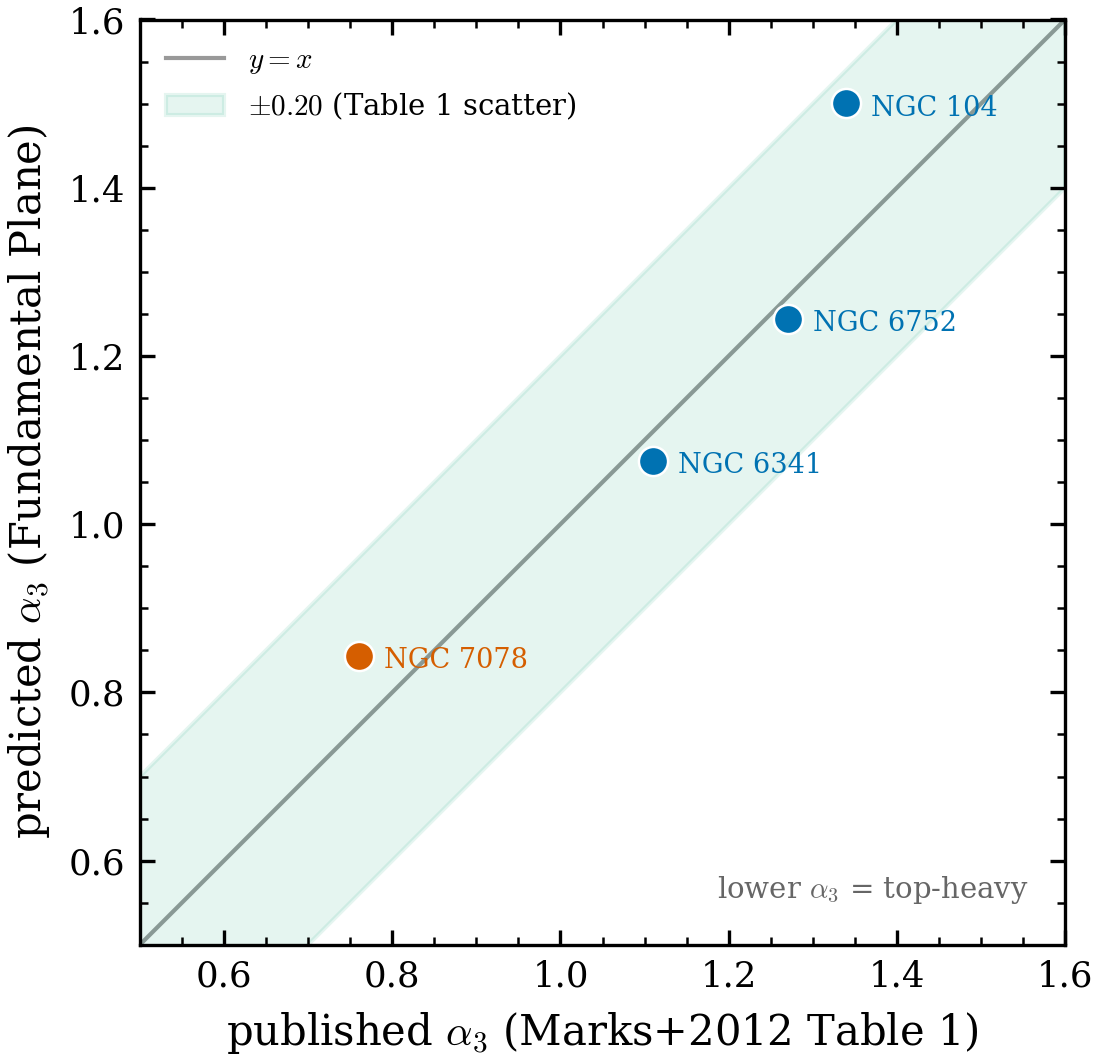
Figure 1:Globular-cluster anchors (headline). Predicted from the Fundamental Plane vs the published Marks et al. (2012) Table 1 values for four GCs, all within the table’s intrinsic scatter (shaded). NGC 7078 / M15 (vermilion) is correctly the most top-heavy; NGC 104 sits at the band edge (, the only one near the scatter limit).
![The Fundamental Plane (erratum-corrected). \alpha_3 over
(\log\rho_{\rm cl},\,[\mathrm{Fe/H}]) with the four GCs overplotted, using the
2014-erratum threshold \hat x \ge -0.87 (continuous; the originally printed +0.87
was a typo — see ). The near-vertical contours show \alpha_3 responds
chiefly to density: a 1-dex change in \rho_{\rm cl} shifts \alpha_3 by 0.40
versus 0.06 for [\mathrm{Fe/H}] — the \sim7{:}1 ratio that places dense,
metal-poor M15 deep in the top-heavy regime, while the diffuse low-density field
(\log\rho_{\rm cl}/10^6 \lesssim -0.9, left edge) smoothly recovers the canonical
\alpha_3 = 2.3.](/progenax/build/env_fundamental_plan-52cc6aa6f6e515f2bfaeb2483ed3f8da.png)
Figure 2:The Fundamental Plane (erratum-corrected). over with the four GCs overplotted, using the 2014-erratum threshold (continuous; the originally printed +0.87 was a typo — see Figure 4). The near-vertical contours show responds chiefly to density: a 1-dex change in shifts by 0.40 versus 0.06 for — the ratio that places dense, metal-poor M15 deep in the top-heavy regime, while the diffuse low-density field (, left edge) smoothly recovers the canonical .
![Metallicity-dependent low-mass slopes. \alpha_1 (0.08–0.5\,M_\odot) and
\alpha_2 (0.5–1\,M_\odot) vs [\mathrm{Fe/H}] ( Eq. 12),
passing exactly through the five Table 4 anchor points (markers). Metal-poor clusters
are bottom-light (shallower low-mass slopes); both slopes reach the canonical 2.3
near and above solar.](/progenax/build/env_lowmass_slopes-f2018dfa74a4f702fea85ccc48dbbf57.png)
Figure 3:Metallicity-dependent low-mass slopes. (0.08–) and (0.5–) vs (Marks et al. (2012) Eq. 12), passing exactly through the five Table 4 anchor points (markers). Metal-poor clusters are bottom-light (shallower low-mass slopes); both slopes reach the canonical 2.3 near and above solar.
![The corrected Marks plane is the Jeřábková IGIMF relation. With the 2014
erratum applied (threshold \hat x \ge -0.87), the Fundamental
Plane (solid lines) and the density-based IGIMF (circles)
coincide for every [\mathrm{Fe/H}] — max |\Delta\alpha_3| = 0.008, purely the
-0.4072-vs--0.41 rounding (Jeřábková Eq. 6 simply adopts the erratum-corrected
relation). The dotted grey curve shows the literally printed Marks+2012 Eq. 14
with its missing-minus-sign typo (\hat x \ge +0.87): it spuriously pins
\alpha_3 = 2.3 out to \hat x = +0.87 and then drops discontinuously to 1.58 —
the artifact the erratum (and Marks+2012 Fig. 6) corrects.](/progenax/build/env_marks_vs_jerabko-cdfbb20534fc65bb90f7a2e2a4b17027.png)
Figure 4:The corrected Marks plane is the Jeřábková IGIMF relation. With the 2014 erratum applied (threshold ), the Marks et al. (2012) Fundamental Plane (solid lines) and the Jeřábková et al. (2018) density-based IGIMF (circles) coincide for every — max , purely the -0.4072-vs--0.41 rounding (Jeřábková Eq. 6 simply adopts the erratum-corrected relation). The dotted grey curve shows the literally printed Marks+2012 Eq. 14 with its missing-minus-sign typo (): it spuriously pins out to and then drops discontinuously to 1.58 — the artifact the erratum (and Marks+2012 Fig. 6) corrects.
![Gradient validation. Autodiff (line) vs central finite difference (circles) for
(a) \partial\alpha_3/\partial[\mathrm{Fe/H}] and (b) \partial\alpha_3/\partial\log\rho
(smoothed-threshold mapping), agreeing to max rel err 9\times10^{-8} — so the birth
environment (\rho_{\rm cl}, [\mathrm{Fe/H}], M_{\rm ecl}) can be inferred by
gradient descent / HMC through the IMF.](/progenax/build/env_gradient_validat-2ac3bacc9db696a216ae67d80239b2cb.png)
Figure 5:Gradient validation. Autodiff (line) vs central finite difference (circles) for (a) and (b) (smoothed-threshold mapping), agreeing to max rel err — so the birth environment (, , ) can be inferred by gradient descent / HMC through the IMF.
How to run
# published-table physics tests (< 1 s)
pytest tests/validation/test_environment_physics.py -q

# regenerate the five figures with PASS/FAIL tables
python scripts/validate_environment.py
Honest scope
The GC tolerance (0.20) is the intrinsic scatter of Marks et al. (2012) Table 1 about its own best-fit plane; NGC 104 sits near that limit ().
alpha3_marks_planeapplies the 2014 erratum (Marks et al. 2014, MNRAS 442, 3315; PDF held): the threshold is , not the +0.87 printed in the 2012 Eq. 14/15 (a missing-minus-sign typo the authors did not use). With this correction the Marks plane and the Jeřábková density relation are the same relation (Figure 4, ); the GC anchors are unaffected because all four GCs lie at high density where +0.87 and -0.87 give identical .The turbulence diagnostics on
BirthEnvironment(turbulent_mach,sigma_ln_rho,spectral_slope) are not inputs to here and are not validated on this page.
References
Marks et al. (2012) (Fundamental Plane, Tables 1 & 4), Marks & Kroupa (2012) (– relation), Jeřábková et al. (2018) (IGIMF). Theory and the full coefficient derivations at Environment-dependent IMFs; per-paper notes in the bibliography.
- Marks, M., Kroupa, P., Dabringhausen, J., & Pawlowski, M. S. (2012). Evidence for top-heavy stellar initial mass functions with increasing density and decreasing metallicity. Monthly Notices of the Royal Astronomical Society, 422, 2246–2254. 10.1111/j.1365-2966.2012.20767.x
- Jeřábková, T., Kroupa, P., Dabringhausen, J., Hilker, M., & Bekki, K. (2018). Impact of metallicity and star formation rate on the time-dependent, galaxy-wide stellar initial mass function. Astronomy and Astrophysics, 620, A39. 10.1051/0004-6361/201833055
- Marks, M., & Kroupa, P. (2012). Inverse dynamical population synthesis. Constraining the initial conditions of young stellar clusters by studying their binary populations. Astronomy and Astrophysics, 543, A8. 10.1051/0004-6361/201118231