The standard cluster-structure statistics are combinatorial and non-differentiable — they rest on a minimum spanning tree and hard subset selections, so they cannot enter a gradient-based inference objective. progenax ships differentiable surrogates for two of them, and this demo validates both against their exact oracles and shows the substructure surrogate is a faithful differentiable loss.
| differentiable surrogate | exact oracle | statistic |
|---|---|---|
q_approx (kNN + softmin) | compute_q_parameter (MST + scipy) | Cartwright & Whitworth (2004) Cartwright & Whitworth, 2004 |
lambda_msr_approx (softmin + soft mass-cut) | compute_lambda_msr (MST) | Allison et al. (2009) Allison et al., 2009 |
Inputs and assumptions
This demo fits nothing — it is a calibration check of differentiable surrogates against exact oracles. Every quantity is a known/fixed generator setting, a swept parameter, or a numerical tolerance.
Table 1:Model inputs
Input | Meaning and role | Status (fiducial) |
|---|---|---|
generators | Substructure sequence (clumpy uniform sphere concentrated) spanning the CW04 range; Plummer is deliberately excluded (, outside the calibrated regime). | known / fixed (toy generators) |
clump / segregation params | Clumpy generator ( clumps, spread 0.06); bimodal segregation cluster (, , 0.5 vs ). | known / fixed |
surrogate softness |
| known / fixed |
core-scale sweep | Segregation strength slid (massive stars pulled into a shrinking core). | sweep input |
, seeds, FD step | 400 particles/cluster; 6 seeds averaged; finite-difference step for the AD-vs-FD check. | numerical choices |
gates | full-sequence , substructure-regime , AD–FD rel-gap , Spearman , null . | numerical choices |
(a) Substructure — calibration in the regime it is used
The CW04 parameter (mean MST edge length over mean
separation) separates substructured () from centrally concentrated
() clusters, anchored at for a uniform sphere. Across a
sequence from a clumpy distribution through a uniform sphere to an
concentrated profile, q_approx tracks the exact :
distribution | exact | ||
|---|---|---|---|
clumpy (substructured) | 0.409 | 0.409 | 0.000 |
uniform sphere | 0.774 | 0.824 | 0.051 |
concentrated | 0.924 | 1.010 | 0.085 |
In the substructure regime — the regime where q_approx is
used for substructure inference — it tracks the exact statistic to
, and it preserves the ordering throughout. The calibration degrades
mildly toward high central concentration (), and a steep Plummer
() is deliberately excluded as outside the CW04-calibrated range, where
neither the exact statistic nor the surrogate is meaningful.
(b) Mass segregation — rank-faithful, sharp-limit exact
Sweeping a bimodal-mass cluster’s segregation strength (massive stars drawn into a
shrinking core), the soft lambda_msr_approx and exact compute_lambda_msr both
rise as the massive population concentrates. The rank correlation is perfect
(Spearman ), and the unsegregated case returns . In the
soft regime used for smooth gradients the surrogate is magnitude-compressed
(it rises to where the exact reaches at extreme
segregation); it converges to the exact magnitude as the softness
(the Oracle-1 limit validated in the segregation-surrogate physics suite). It is a
rank/gradient-faithful observable, not a drop-in for the absolute .
(c) The substructure surrogate is a faithful differentiable loss
With — raising each point’s radius to the power
, so larger is more centrally concentrated — the autodiff gradient
matches the finite-difference slope 0.169 at
to 4.0%. (The small gap is finite-difference truncation across
kNN-cell boundaries, which shrinks as ; the autodiff value is the correct
local gradient.) So q_approx can drive a gradient-based objective — its purpose.
Figure
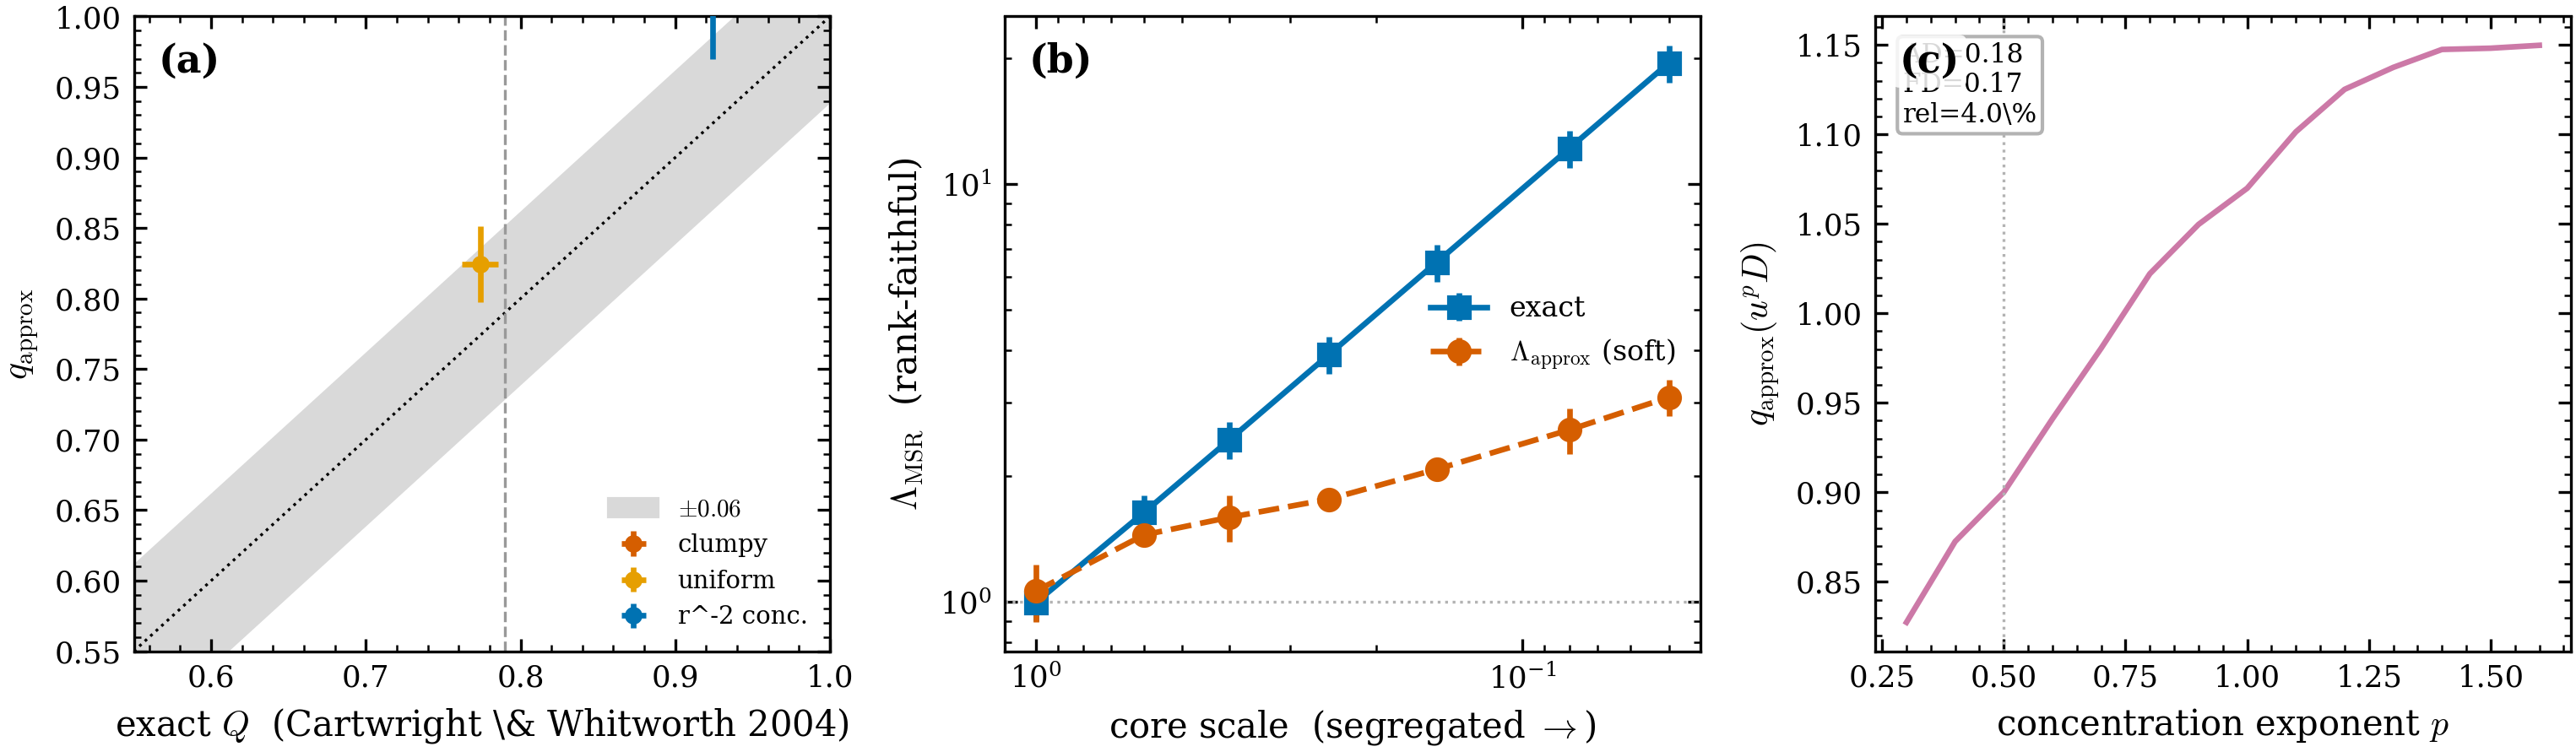
Figure 1:Differentiable structure diagnostics (scripts/demo_diff_diagnostics.py, ALL
PASS). (a) vs exact across the substructure→concentration
sequence; the band and the line, with the CW04 uniform-sphere anchor
(dashed). (b) vs segregation strength (log–log):
exact (blue) and the rank-faithful soft surrogate (vermilion), both rising as the
massive stars concentrate. (c) vs the concentration
exponent ; the autodiff vs finite-difference gradients agree to 4% at .
Caveats
How to run
env -u VIRTUAL_ENV uv run --no-sync python scripts/demo_diff_diagnostics.pyReferences
The substructure parameter is Cartwright & Whitworth (2004); the mass-segregation ratio is Allison et al. (2009). The surrogates and their exact-limit convergence are documented on the JAX-native substructure and mass-segregation pages.
- Cartwright, A., & Whitworth, A. P. (2004). The statistical analysis of star clusters. Monthly Notices of the Royal Astronomical Society, 348, 589–598. 10.1111/j.1365-2966.2004.07360.x
- Allison, R. J., Goodwin, S. P., Parker, R. J., Portegies Zwart, S. F., de Grijs, R., & Kouwenhoven, M. B. N. (2009). Using the minimum spanning tree to trace mass segregation. Monthly Notices of the Royal Astronomical Society, 395, 1449–1454. 10.1111/j.1365-2966.2009.14508.x